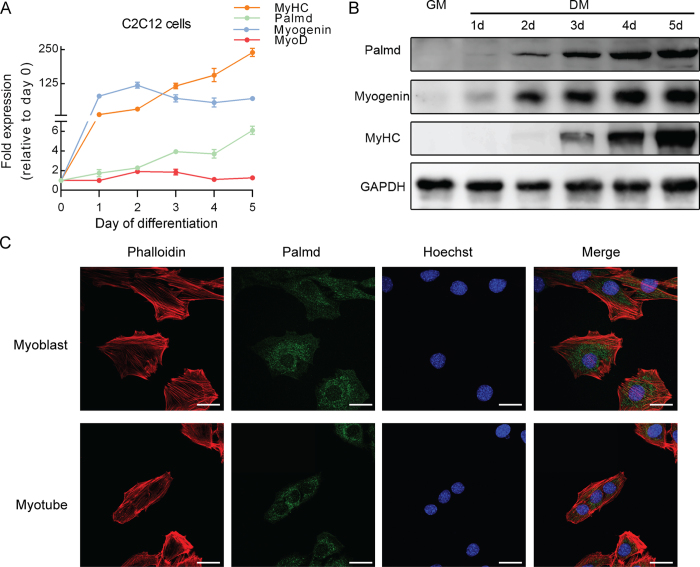
Figure 1. Palmd expression and location during C2C12 myoblast differentiation.
(A) qPCR for the Palmd, Myogenin, MyoD and MyHC expression profile during C2C12 myoblast differentiation at the indicated time points, showed up-regulation of Palmd after differentiation. Data are presented as mean ± s.e.m., n = 3 per group. (B) The protein levels of Palmd, Myogenin, MyHC during C2C12 myoblast differentiation showed a similar result. GM: growth medium, DM: differentiation medium. (C) Immunofluorescence staining for Palmd (green) together with Phalloidin (red) and nucleus (blue) staining in myoblast and myotube. Scale bar = 25 μm.

