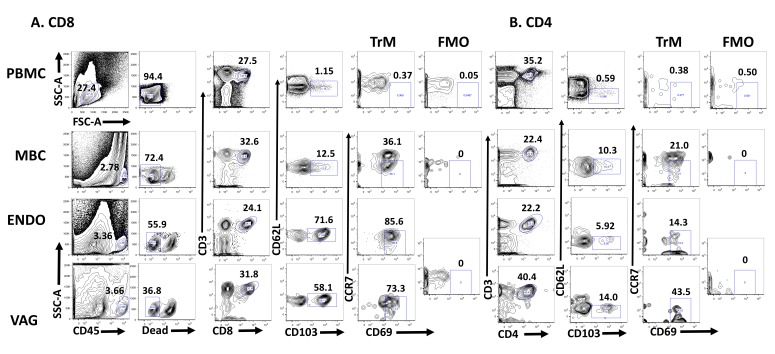
Figure 1.
Sample gating strategy. (A) The percent CD3+CD8+ and (B) CD3+CD4+ Tissue Resident T cells (CD62L-CD103+CCR7-CD69+) is shown. The flow plots represent TrM cells present in paired PBMC and MBC from an HIV-positive woman and endometrial (ENDO) and vaginal tissue from an anonymous remnant sample. Fluorescence minus one (FMO) is set individually for PBMC, MBC, and ENDO/VAG (which share the same FMO, because they are from the same donor). The percent of the gated population is shown above the gate.

