Figure 2.
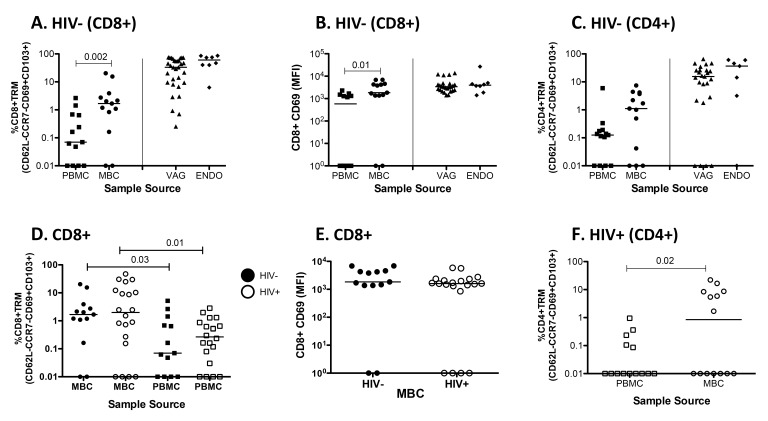
Tissue Resident T cells are present in the FGT. (A) The percentage of CD3+CD8+ TrM (CD62LCD103+CCR7-CD69+) cells present in paired PBMC and MBC from HIV-negative women and from vaginal (VAG) and endometrial (ENDO) tissue from anonymous remnant samples. (B) Mean Fluorescence Intensity (MFI) of CD8+CD69+ T cells for paired PBMC and MBC from HIV negative women and from VAG and ENDO tissue from anonymous remnant samples. (C) The percentage of CD3+CD4+ TrM cells present in paired PBMC and MBC from HIV-negative women and VAG and ENDO tissue from anonymous remnant samples. (D) The percent of CD3+CD8+ TrM present in paired MBC and PBMC between HIV-negative and positive women. (E) CD69 MFI between CD8+CD69+ TrM from MB cells from HIV negative and positive women. (F) The percentage of CD3+CD4+ TrM cells present in paired PBMC and MBC from HIV positive women. Fluorescence minus one (FMO) is set individually for PBMC and MBC. Horizontal line represents median value. Statistically significant differences (P < 0.05) were obtained using the Wilcoxon Rank test for paired samples and for unpaired we used the Mann Whitney test. Although not noted in the graph, differences were also detected between PBMC and MBC and tissues (VAG and ENDO).

