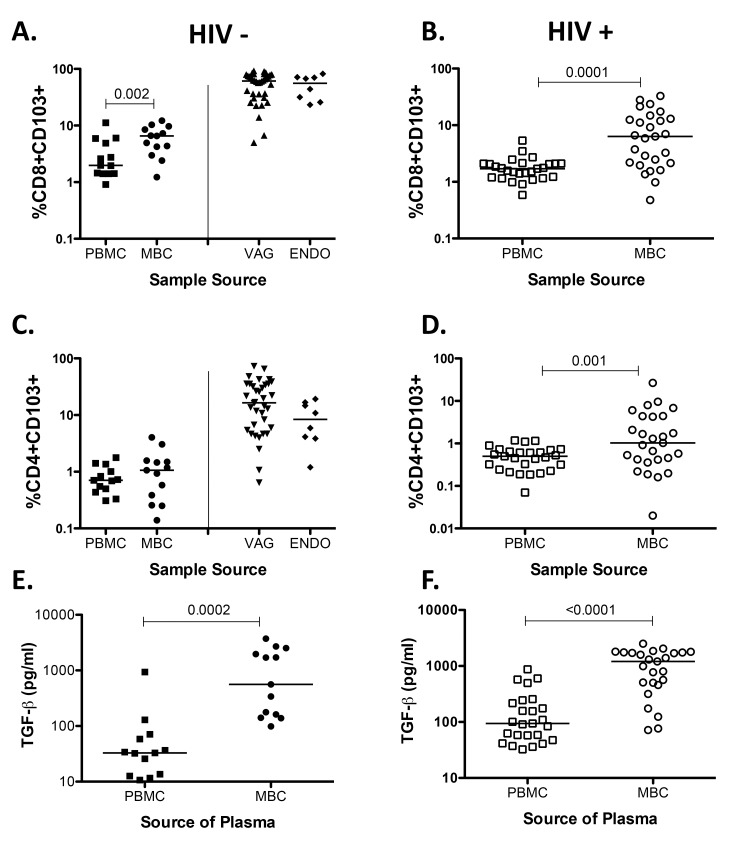
Supplemental Figure 1.
Percent of CD103 and TGF-β concentration from HIV-seronegative samples (closed symbols) and HIV-seropositive samples (open symbols). (A) %CD8+CD103+. (B) %CD8+CD103+. (C) %CD4+CD103+ (D) %CD4+CD103+ (E) TGF-β concentration in plasma from PBMC and MBC from HIV-seronegative samples. (F) TGF-β concentration in plasma from PBMC and MBC from HIV-seropositive samples. Horizontal line represents median value. Statistically significant differences (P < 0.05) were obtained using the Wilcoxon Rank test for paired samples. Although not noted in the graph, differences were also detected between MBC and tissues (VAG and ENDO).

