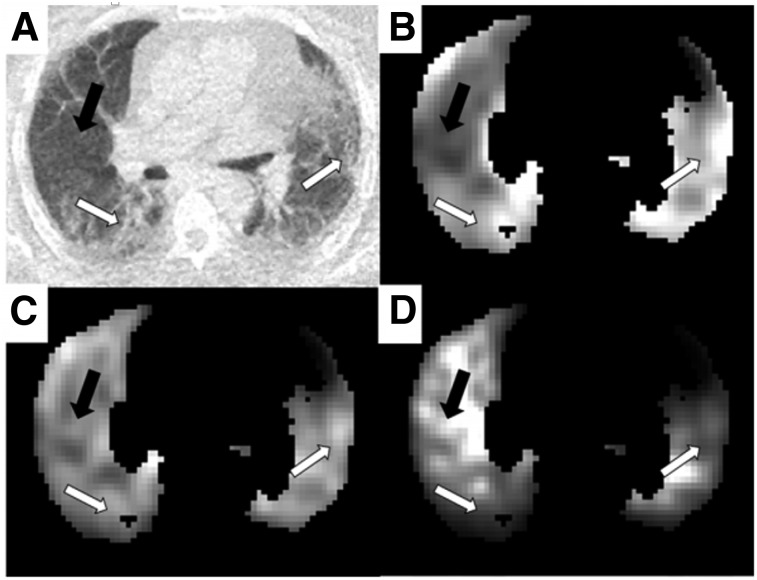
FIGURE 4.
Patlak Ki parametric images from IPF patient undergoing dynamic 18F-FDG study. (A) CT image displaying regions of obvious fibrosis (white arrows) and region of normal-appearing tissue (black arrow). (B–D) Patlak parametric images before air and blood correction (B), after air fraction correction (C), and after air and blood fraction correction (D). All images have been normalized such that they can be shown on same arbitrary gray scale. Images have been masked to show only lung. (Reprinted from (21).)

