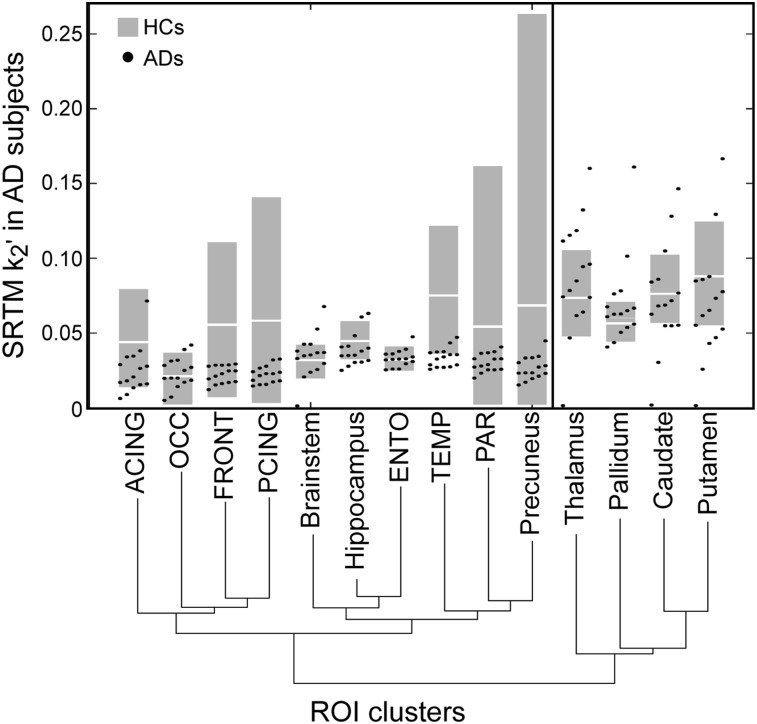
FIGURE 2.
SRTM k2’ agglomerative hierarchical clustering for AD subjects. Plot shows SRTM k2’ values of ROIs in AD subjects used to perform the clustering. Branches show levels of clustering. Gray boxes show 10th–90th percentile of SRTM k2’ for HC, white line is mean of HC; HC subjects not used in clustering.

