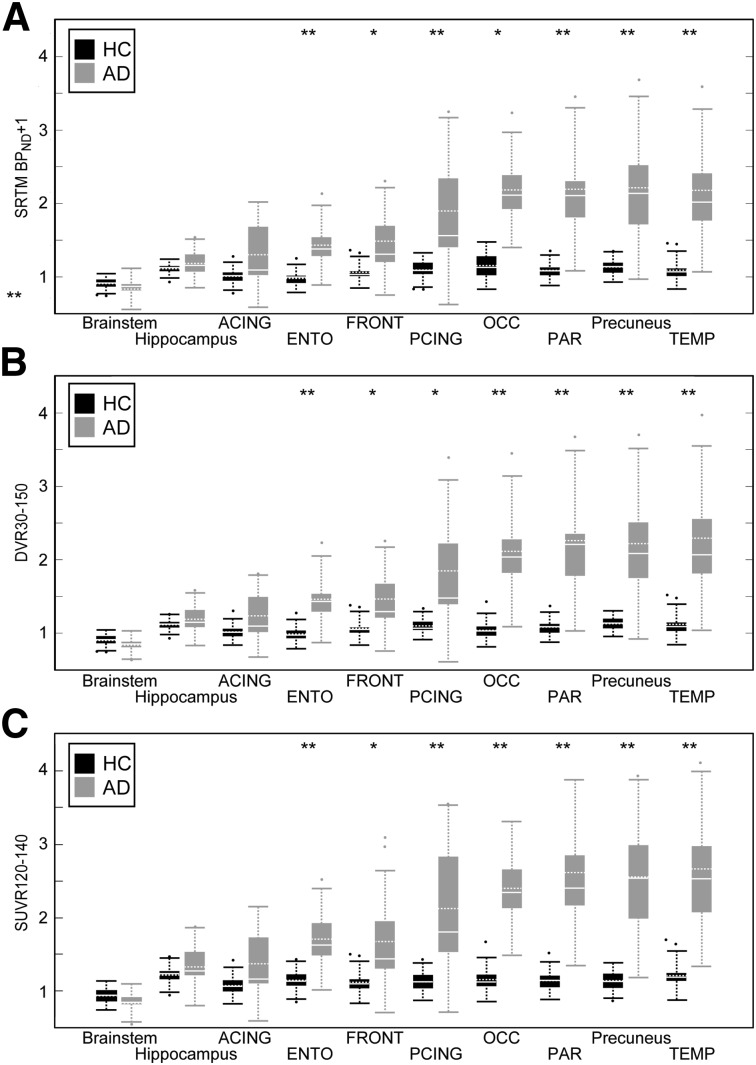
FIGURE 7.
Welch’s t test between HCs and ADs in SRTM BPND + 1 (A), DVR30–150 (B), and SUVR130–150 (C). Boundaries of boxes represent 25th–75th percentiles, solid horizontal white line is median, dashed horizontal white line is mean, dashed vertical line is 5th–95th percentiles. **P < 0.001. *P < 0.01, Bonferroni-corrected.

