Figure 2.

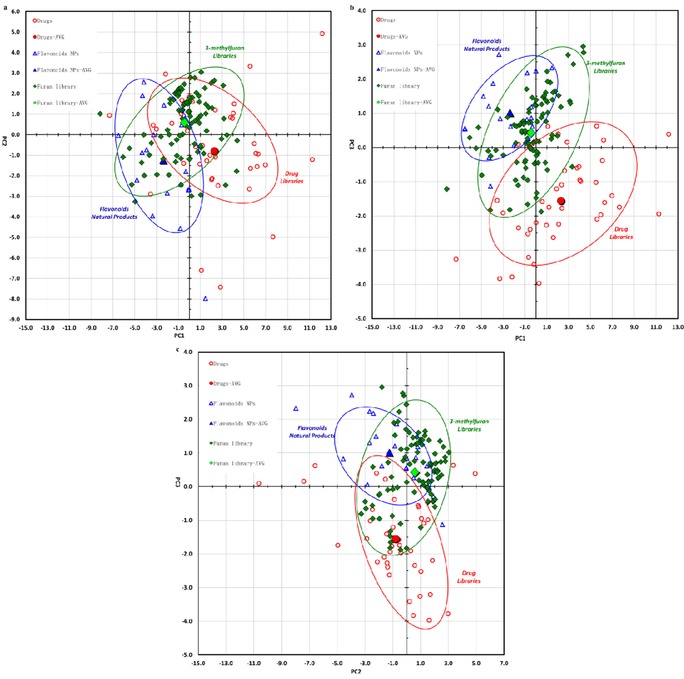
Comparative PCA plots. Ninety‐nine DOS library compounds (green), 40 top‐selling brand‐name drugs (red) and 20 coumarins and flavonoid natural products (blue) were used; a) PC1 versus PC2; b) PC1 versus PC3; c) PC2 versus PC3.

Comparative PCA plots. Ninety‐nine DOS library compounds (green), 40 top‐selling brand‐name drugs (red) and 20 coumarins and flavonoid natural products (blue) were used; a) PC1 versus PC2; b) PC1 versus PC3; c) PC2 versus PC3.