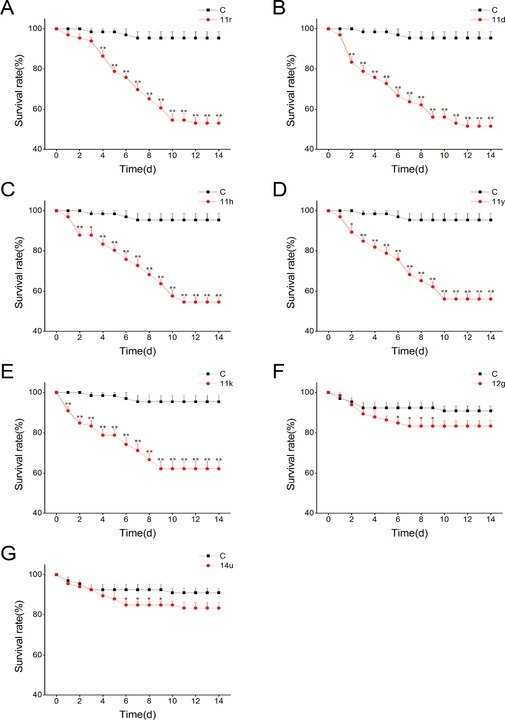
Figure 3.

Mean survival rate of N. lugens nymphs (+SE, n=6) on plants, that had been treated with one of the compounds, at a concentration of 20 mg L−1 24 h before exposure versus control plants (C), 1–14 d after exposure. Asterisks indicate significant differences between treatments and controls at each time point (*P<0.05, **P<0.01, Student's t‐tests).
