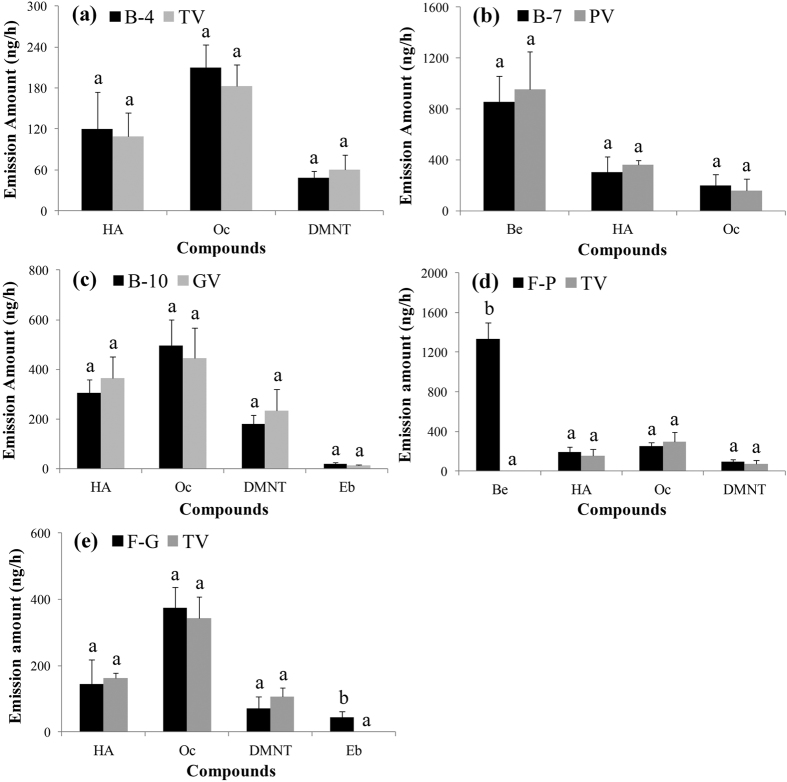
Figure 2. Emission amount (mean + SE, n = 4) of synthetic blends and three plant volatiles in different Y-tube tests.
(a) Blend 4 (B-4) vs. tea plant volatiles (TV). (b) Blend 7 (B-7) vs. peach plant volatiles (PV). (c), Blend 10 (B-10) vs. grapevine volatiles (GV). (d) Formula-P (F-P) vs. tea plant volatiles. (e) Formula-G (F-G) vs. tea plant volatiles. B-4, B-7, B-10, F-P, and F-G were synthetic blends (see Table 1 for composition). HA, (Z)-3-hexenyl acetate; Oc, (E)-ocimene; DM, (E)-4,8-dimethyl-1,3,7-nonatriene; Be, benzaldehyde; EB, ethyl benzoate. Different letters on bars indicate significant differences (one-way ANOVA followed by Tukey’s multiple comparison test, P < 0.05).

