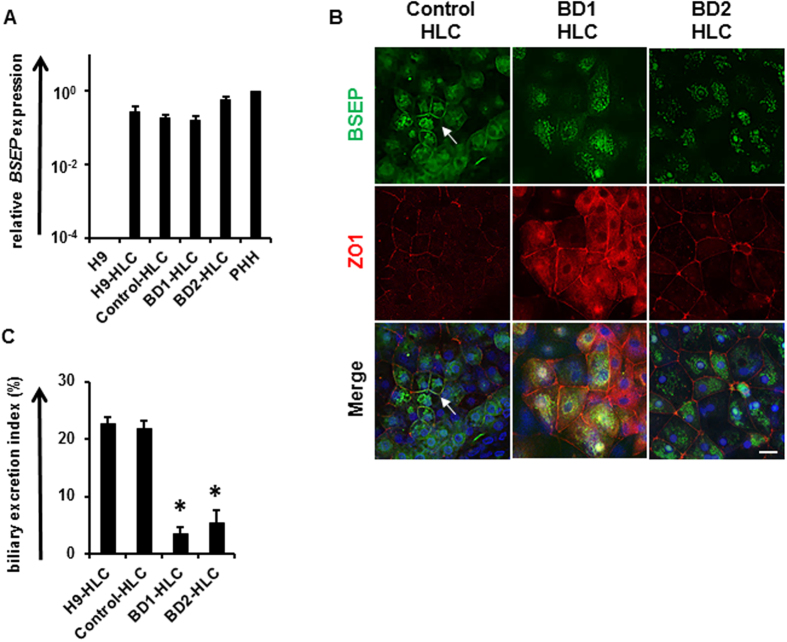
Figure 4. Analysis of BSEP expression and biliary excretion in the BD-HLCs.
(A) Gene expression levels of BSEP in the HLCs as examined by real-time RT-PCR. The gene expression levels in PHH were taken as 1.0. Data represent mean ± SD (n = 3). (B) Immunofluorescence double staining of BSEP and ZO-1 in the different HLCs. White arrow indicates the co-localization of BSEP and ZO-1. (C) BEI of CLF-treated HLCs. Data represent mean ± SE (three independent differentiation experiments). Statistical significance was evaluated by one-way ANOVA in Tukey’s test. *P < 0.05. The scale bar represents 20 μm.

