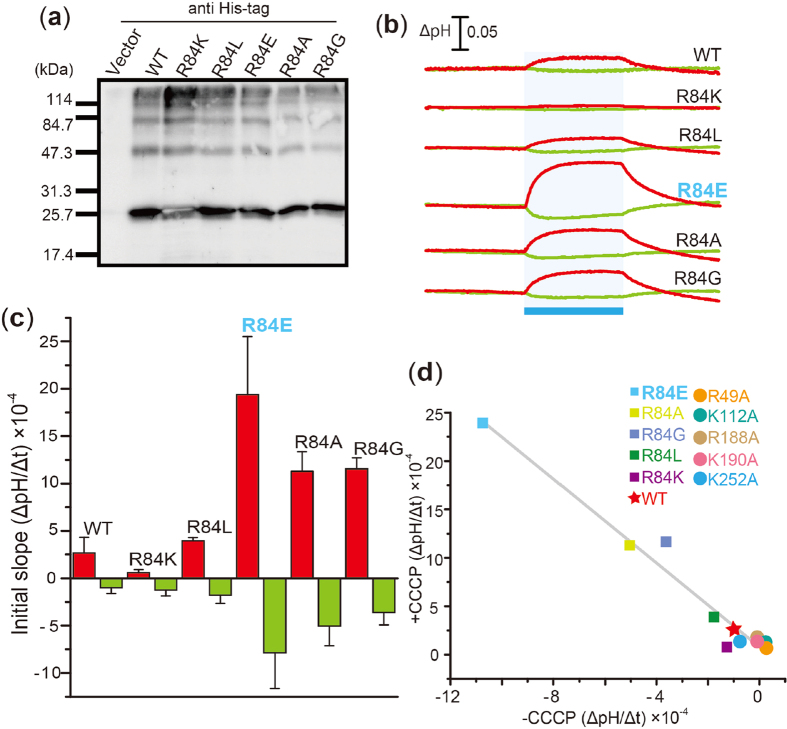
Figure 4. Anion transport activity in R84 mutants.
(a) Detection of protein expression of R84 mutants. The mutant proteins were expressed in E. coli cells with a His-tag at the C-terminus. These proteins were detected using an anti His-tag antibody. Cells harboring the pET22b vector plasmid were used as a negative control. (b) Light-induced pH changes of E. coli cell suspensions expressing R84 mutant proteins in a solution containing 300 mM NaCl. The suspensions were illuminated with blue light (480 ± 10 nm, ca. 9 mW/cm2) for 3 min (blue stripe). The red and green lines indicate pH changes in the presence or absence of 10 μM CCCP, respectively. (c) Comparison of the ion transport activity of the R84 mutant proteins. The initial slope amplitudes of the light-induced pH changes of E. coli cell suspensions in 300 mM NaCl are plotted. Several independent experiments were averaged (n = 3–18). (d) Correlation between the increases and the decreases in pH upon blue-light illumination. The initial slope amplitudes of cells expressing ACR2 are plotted. The correlation coefficient was determined as 0.96.

