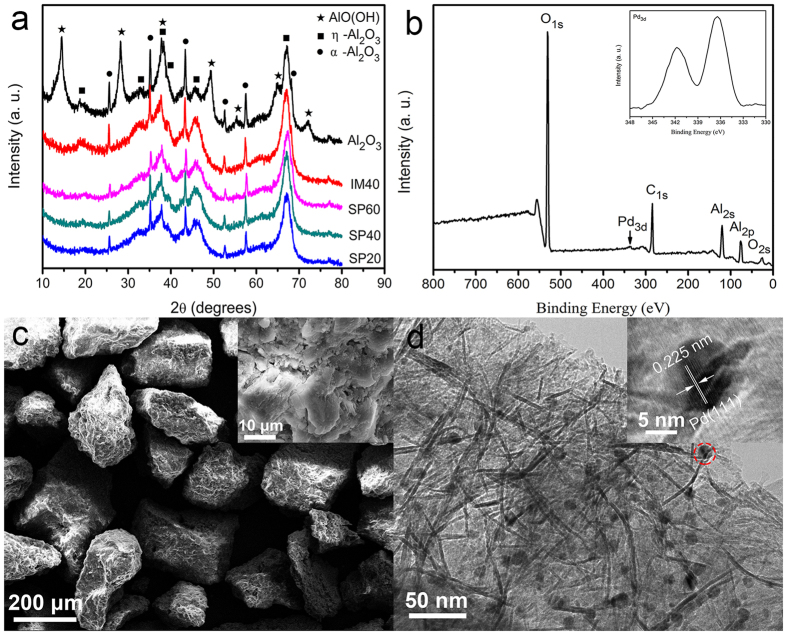
Figure 1.
(a) XRD patterns of activated Al2O3 and Pd/Al2O3 catalysts with a series of grounded activated Al2O3 particle sizes. (b) to (d) The representative XPS survey spectrum (b), SEM image (c), and TEM image of SP60 sample. (Note: The insert image in Fig. 1c shows the SEM image with a higher magnification, and the insert image in Fig. 1d shows the corresponding HRTEM image of the Pd nanoparticle with red circle.).

