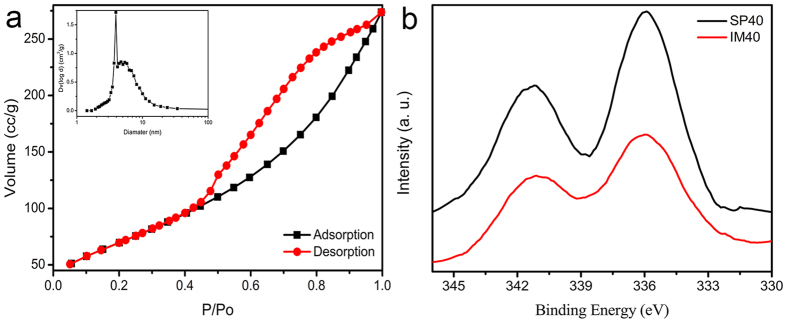
Figure 2.
(a) The representative N2 adsorption/desorption isotherms of SP60 sample. (Note: Insert image in Fig. 2a shows the pore size distribution of SP60 sample calculated from the desorption data with BJH model.) (b) High resolution XPS scans over Pd 3d peaks of SP40 and IM40 samples, respectively.

