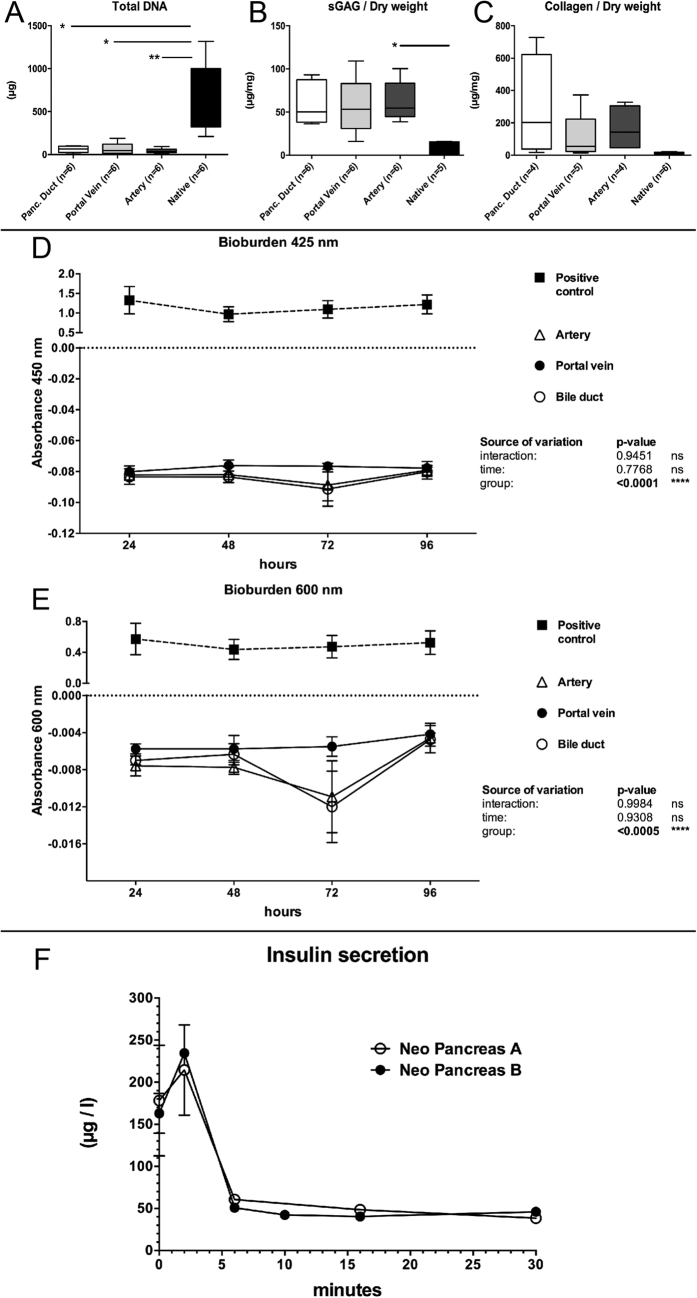
Figure 4. Biochemical evaluation.
The amount of DNA significantly declined in all experimental groups compared to native controls (A). No statistically significant differences were observed between the experimental groups. The content of sulfated Glycosaminoglycans (sGAG) per dry weight (B) increased compared to native controls due to a loss of cellular protein mass. No statistically significant differences were observed between the experimental groups. The collagen content per dry weight (C) increased compared to native controls due to a loss of cellular protein mass. No statistically significant differences were observed between the experimental groups. Bioburden testing at 425 nm (D) and 600 nm (E) revealed that all experiments were sterile and not contaminated. Insulin analysis revealed that Insulin levels in the perfusate initially increased after high glucose perfusion and then were constant until the end of the perfusion (F).

