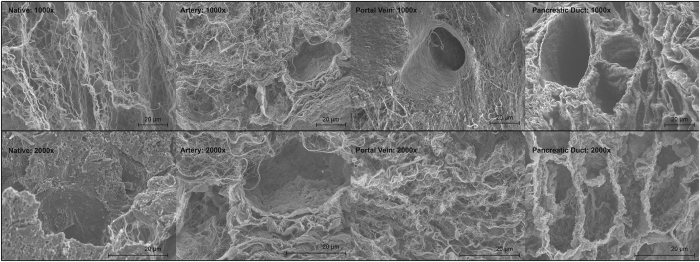
Figure 6. Scanning electron microscopy (SEM) of decellularized pancreata.
SEM at a magnification of 1000 and 2000 was performed to analyze the matrix composition after decellularization via the different perfusion routes and compare them with native controls. SEM showed intact protein fibers of the decellularized pancreata and empty cellular spaces compared to native controls. No significant differences were observed between the three experimental groups.

