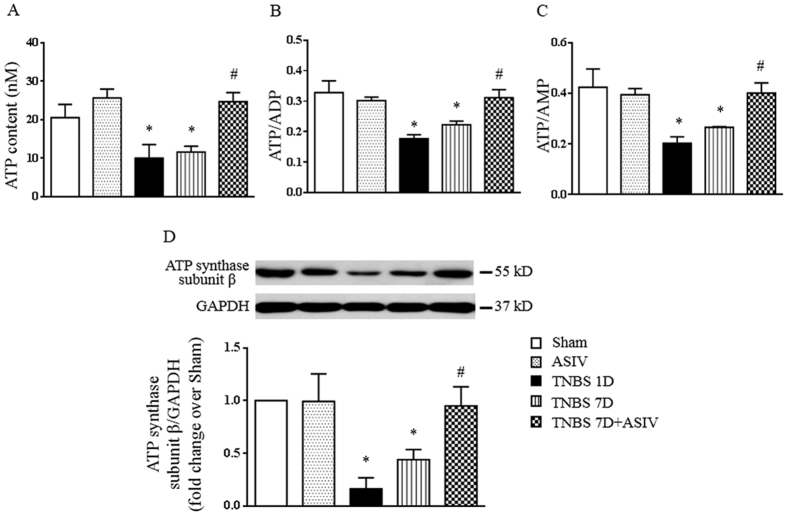
Figure 8. ASIV increases ATP content and ATP synthase subunit β expression in TNBS-challenged rat colon.
(A) The concentration of ATP in colon tissues from different groups. (B) and (C) The ratio of ATP/ADP and ATP/AMP, respectively, in different groups. (D) Representative Western blots and statistical analysis of ATP synthase subunit β in colon tissues from different groups. Sham: sham group; ASIV: ASIV alone group; TNBS 1D: TNBS treatment for 1 day group; TNBS 7D: TNBS treatment for 1 days followed by saline treatment for 6 days group; TNBS 7D + ASIV: TNBS treatment for 1 day followed by ASIV treatment for 6 days group. Data are mean ± SEM (N = 5). *p < 0.05 vs. Sham group, #p < 0.05 vs. TNBS 7D group.

