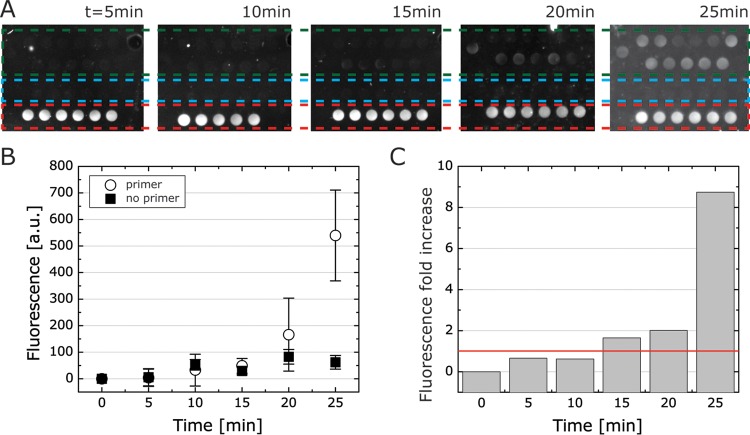
FIG 6.
A time lapse of B-chip RPAs for S. aureus detection using an ImageQuant. (A) A panel of images depicting the RPA fluorescence readout from on-chip assays of S. aureus with primers (green dashed box), no primers (blue dashed box), and 6-FAM control (200 nM, red dashed box); we quantified fluorescence using an ImageQuant. (B) Fluorescence over time for primer versus no primer. a.u., arbitrary units. (C) Fluorescence fold change for data from panel B, and red line indicates fold change at 1.

