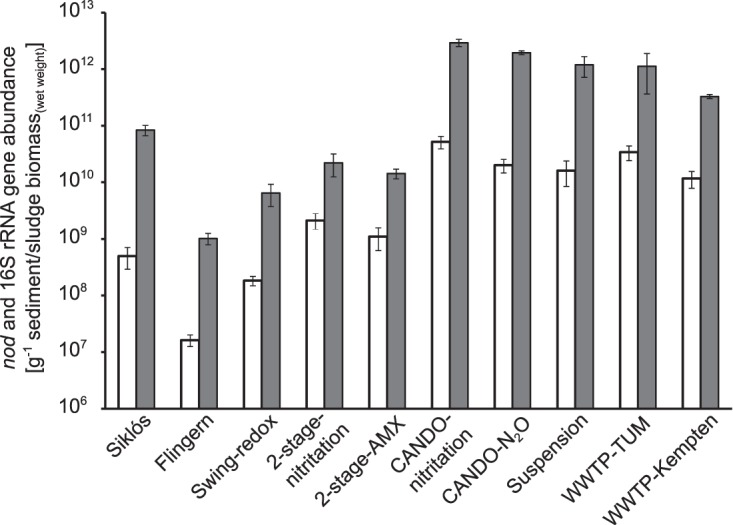
FIG 4.

Absolute abundance of nod (open bars) and bacterial 16S rRNA (gray bars) in the investigated samples. Gene counts are shown as the average ± standard deviation (SD) from at least three technical qPCR replicates per sample, in which WWTP-TUM is from biologically replicated DNA extracts.
