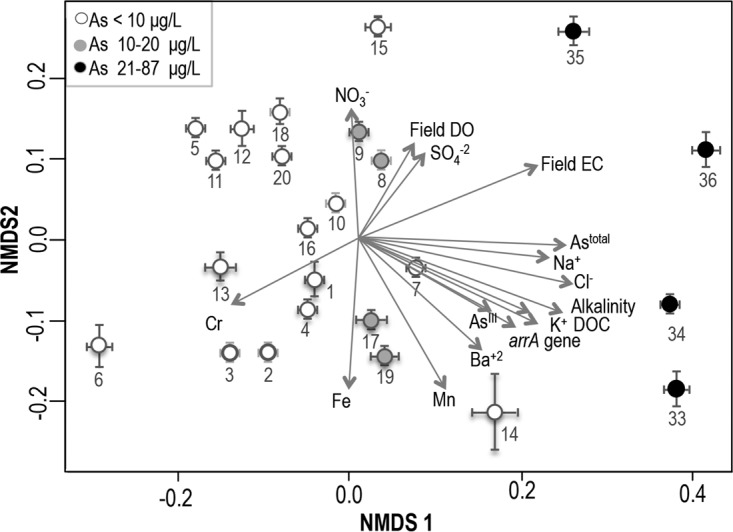
FIG 5.

NMDS plots representing different groundwater quality parameters, based on a Euclidean distance matrix. The black circles represent four samples that were associated with the Logan landfill site. The lengths and directions of the arrows indicate the strength and nature, respectively, of the associations of different water quality parameters.
