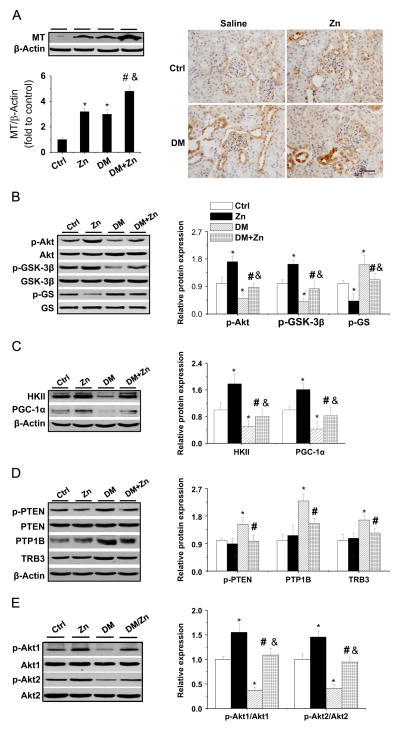
Fig. 3.
Effects of Zn on the expression of renal MT, Akt, and Akt’s downstream effectors and negative regulators in OVE26 type 1 diabetes mice. (A) Zn-induced renal MT expression was detected by Western blot assay and immunohistochemical staining. (B) Phosphorylation of Akt, GSK-3β, and GS, as well as (C) the expression of HKII and PGC-1α, was examined by Western blot assay. (D) The phosphorylation of PTEN and the expression of PTP1B and TRB3 along with (E) the phosphorylation of Akt1 and Akt2 were examined by Western blotting. Data are presented as the mean ± SD (n = 6). *p < 0.05 vs control (Ctrl); #p < 0.05 vs DM. Bar, 50 μm; &p<0.05 vs the Zn supplementation (Zn).

