
Fig. 8.
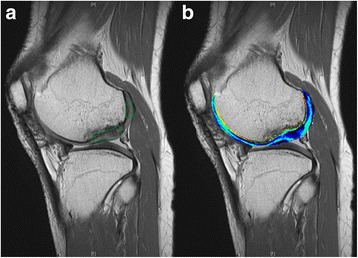
a The change in quantitative R1 in regenerated cartilage and in native cartilage were obtained at the marked areas to calculate the relative R1 index, which equals 1.0 in the case of perfect regeneration. b Higher T1 values (marked in blue) were associated with increased relative GAG content, which was observed in regenerated cartilage