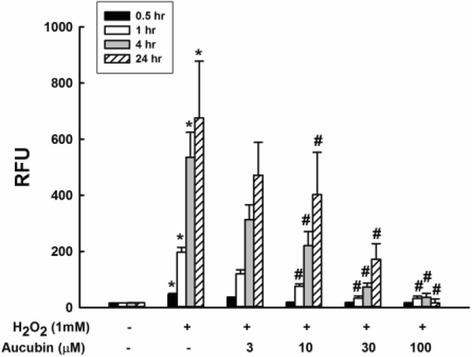
Fig. 2.

ROS scavenge test of aucubin. Chondrocytes pretreated with 0, 3, 10, 30 and 100 μM of aucubin for 0.5, 1, 4 and 24 h were stimulated with 1 mM H2O2 for 30 min. ROS production was measured by the intensity of the dye fluorescence and represented as relative fluorescence unit (RFU). Results shown represent mean ± SD obtained from five repeated measurements. *p < 0.05 compared with the control group. # p < 0.05 compared with the H2O2 group
