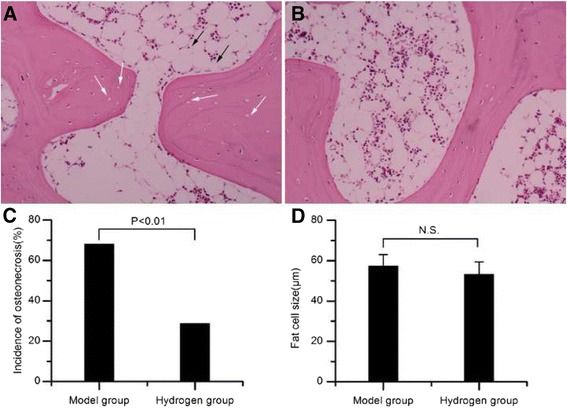
Fig. 1.

Histological observation. a Representative ON+ sample in the model group showed more empty lacunae within the bone trabeculae (indicated by white arrow), surrounded by necrotic medullary haematopoietic cells and necrotic fat cells(indicated by black arrow). b Representative ON− sample in the hydrogen group showed less empty lacunae or osteocytes having pycnotic nuclei, surrounded by abundant normal marrow hematopoietic cells. c The ON incidence in the hydrogen group was significantly lower than that of the model group (P < 0.01). d There were no statistical difference about the size of fat cells between the hydrogen group and the model group (P > 0.05). N.S., not significant
