
Fig. 6.
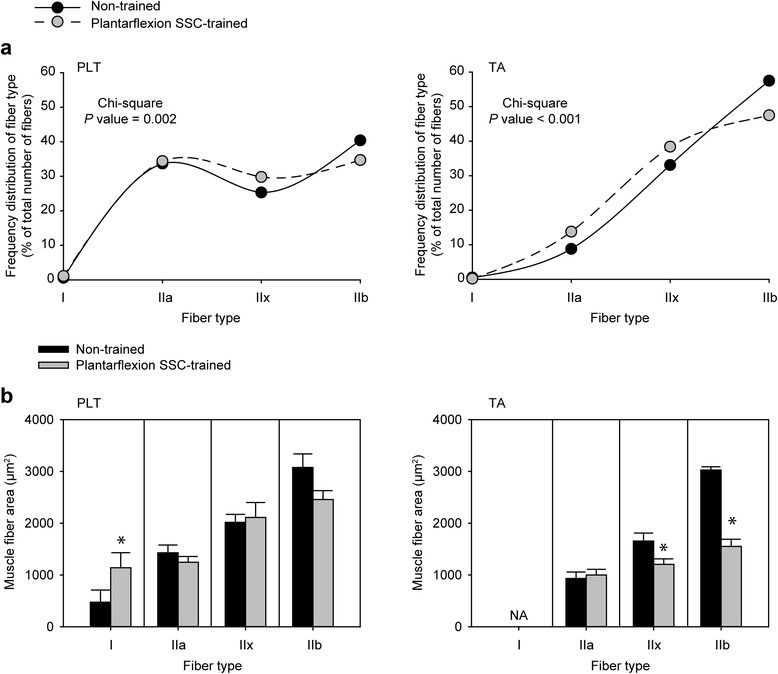
Quantification of fiber type distribution and size for PLT and TA muscles. a Frequency distributions for fiber type are presented as percentage of total number of fibers counted for each group (N = 9 muscles per group). Chi-square analysis was performed to determine alterations in distribution with training. b Mean muscle fiber size for each fiber type. Values are means ± SE. *Different from non-trained value, P < 0.05