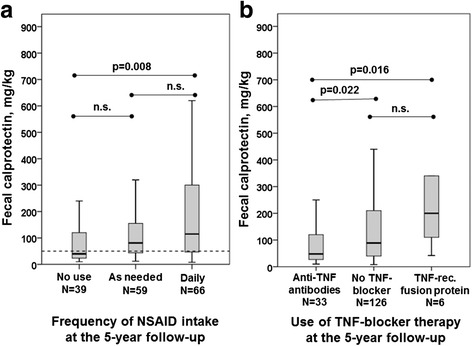
Fig. 3.

a Box plot showing the association between fecal calprotectin and frequency of NSAID intake at 5-year follow-up. b Box plot showing the distribution of fecal calprotectin among patients on anti-TNF antibodies (infliximab, adalimumab, golimumab) vs. no TNF blocker therapy vs. TNF receptor fusion proteins (etanercept) at 5-year follow-up. Values are median (horizontal lines), IQR (boxes), and total range (whiskers). NSAID Nonsteroidal anti-inflammatory drug, TNF Tumor necrosis factor
