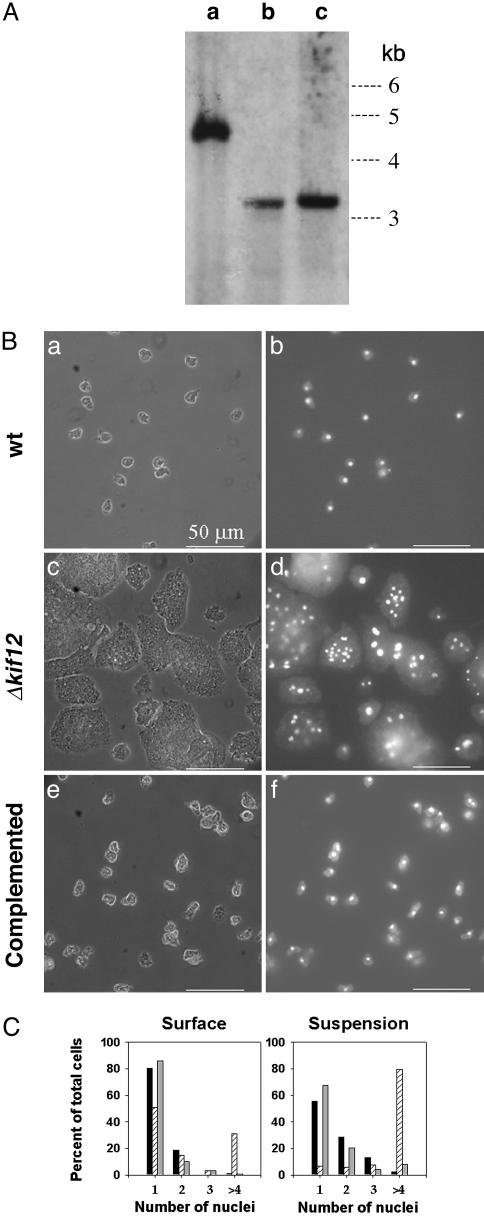
Fig. 1.
Establishing the kif12 knockout in Dictyostelium. (A) Genomic DNA from the parental strain and two independent knockout strains was subjected to restriction digestion by AccI and used for Southern blot analysis. A 500-bp DNA fragment from the N terminus of the gene was used as a probe (indicated in Fig. 6). Lane a shows a 4.6-kb band, expected for the parental strain. Lanes b and c, containing DNA from strains KO1 (HS50) and KO2 (HS51), respectively, show a 3.4-kb band, which is expected from homologous recombination with the knockout construct shown in Fig. 6. (B) Morphology of Dictyostelium cells. The phase-contrast image is shown in a, c, and e; b, d, and f show nuclear staining (with 4′,6-diamidino-2-phenylindole) for the parental wild-type (wt) strain (a and b), the Δkif12 strain (c and d), and the Δkif12 strain rescued with GFP-Kif12 (e and f). (C) Effect of deletion of kif12 on cytokinesis of Dictyostelium. Left shows the comparison of the number of nuclei per cell when grown on a surface for wild-type (black bars) and Δkif12 (hatched bars) cells and Δkif12 cells complemented with kif12 (gray bars). In each case, n = 200. Right shows the comparison of the number of nuclei per cell when grown in suspension.

