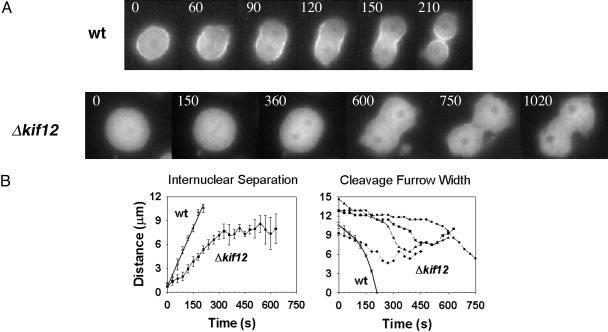
Fig. 3.
Characterization of Δkif12 cells expressing GFP-myosin II. (A) Time-lapse images show the localization of GFP-myosin II in wild-type (wt) and Δkif12 cells. (Upper) Wild-type cells undergoing cytokinesis. GFP-myosin II is localized strongly at the cleavage furrow (representative of 20 cells imaged). (Lower) Δkif12 cells expressing GFP-myosin II at a stage similar to that of the wild-type cells. No distinct localization of GFP-myosin II is observable at the cleavage furrow in the Δkif12 cells (representative of 30 cells imaged). Time is indicated in seconds. (B) Internuclear distance and width of the cleavage furrow with time in wild-type and Δkif12 cells. Left shows the internuclear separation, and Right shows the width of the cleavage furrow. Five cells were averaged to obtain the wild-type nuclear separation data and the wild-type cytokinesis data. The width of the cleavage furrow is shown for representative Δkif12 cells because there was a large variation in the cleavage furrow width, unlike the situation for wild-type cells, for which the average of six cells is shown.

