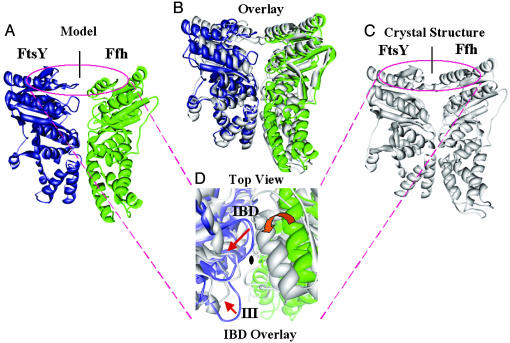
Fig. 3.
Modeling of the Ffh·FtsY NG domain complex. (A–C) Side view of the computational model (A), crystal structure (C), and their overlay (B). (D) Top view of the overlaid structures. Red arrows indicate the rearrangement of motif II (IBD, insertion box domain loop) and motif III on FtsY, which account for the roughly 12° rotation of Ffh between the model and the crystal structure (red block arrow).

