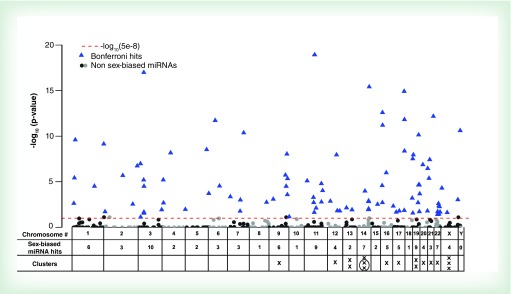
Figure 4. . Manhattan plot of -log10 Bonferroni-adjusted p-values for the group of miRNAs filtered by their expression in different chromosomes.
The dashed red line indicates the Bonferroni cut-off set at 8 × 10⁻⁵ that was calculated by dividing an alpha = 0.05 by 564 tests. Blue triangles represent miRNAs that were differentially expressed between boys and girls after Bonferroni correction.

