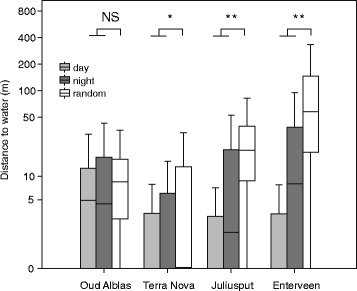
Fig. 3.

Distance to water in different landscapes during daytime and night time compared to 1000 random points in the same landscape. The boxplots show the median with 25th and 75th percentiles and error bars represent the range of 95% of all positions. Significance levels of differences between GPS positions and random points are depicted (* p < 0.05; ** p < 0.01). Note the log scale of the y-axis
