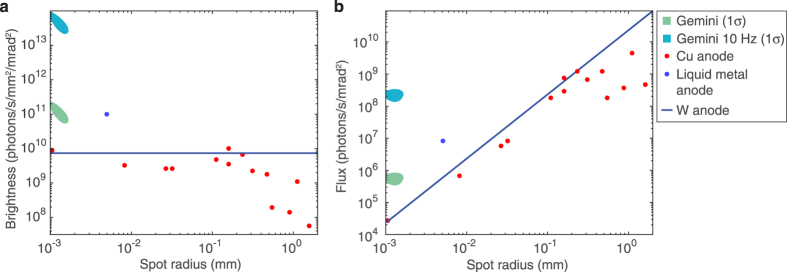
Figure 4. The brightness and flux of the laser-driven source at current and proposed repetition rates compare favourably to existing microfocus sources:
(a) Given the measured fluctuation in photon number and source size, the 1σ contour of expected brightness is plotted in the brightness-spot size plane, plotted in units of photons per second per mm2 of source area per mrad2 of solid angle. Experimental data from microfocus sources are plotted as points, adapted from37,38. The solid line represents the simulated upper limit of a tungsten anode, using measured anode melting points39 and simulated spectra40. The number of photons is integrated over energies 10 keV < Eγ < 100 keV. (b) Accounting for the x-ray spot size, the brightness data are plotted as an average photon flux.

