
Figure 4.
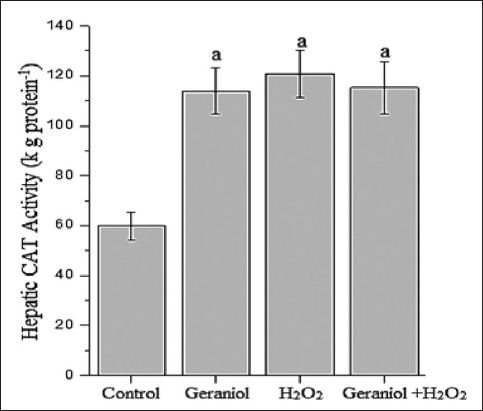
Hepatic catalase activity of the groups. aP<0.001 vs. control group, (one-way analysis of variance followed by post-hoc Tukey’s honestly significant difference test), n=7 for each group
Official websites use .gov
A
.gov website belongs to an official
government organization in the United States.
Secure .gov websites use HTTPS
A lock (
) or https:// means you've safely
connected to the .gov website. Share sensitive
information only on official, secure websites.
Hepatic catalase activity of the groups. aP<0.001 vs. control group, (one-way analysis of variance followed by post-hoc Tukey’s honestly significant difference test), n=7 for each group