Figure 5.

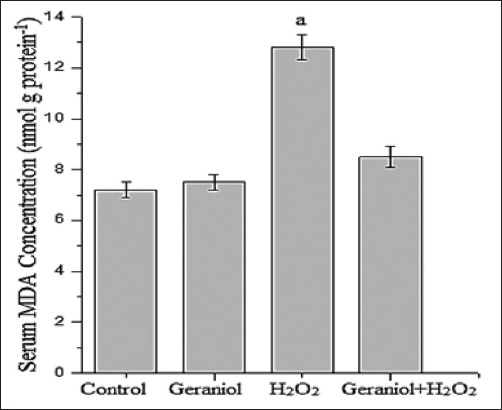
Serum malondialdehyde concentration of the groups. aP<0.001 vs. control group, (one-way analysis of variance followed by post-hoc Tukey’s honestly significant difference test), n=7 for each group

Serum malondialdehyde concentration of the groups. aP<0.001 vs. control group, (one-way analysis of variance followed by post-hoc Tukey’s honestly significant difference test), n=7 for each group