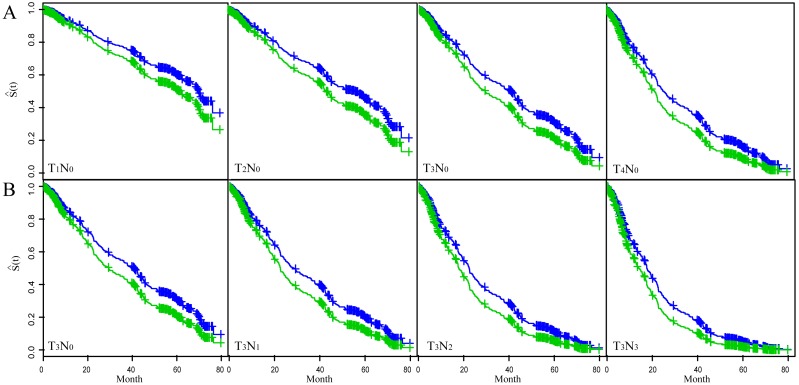
Figure 2. The fitted result of ESCC patients based on the multivariate Cox proportional hazard regression model.
The fitted survival curve (S(t)) for ESCC patients with T1–4N0 status (A) and T3N0–3 status (B). Each figure showed S(t) for two different tumor length groups. Blue line: tumor length ≤3 cm; Green line: tumor length >3 cm.

