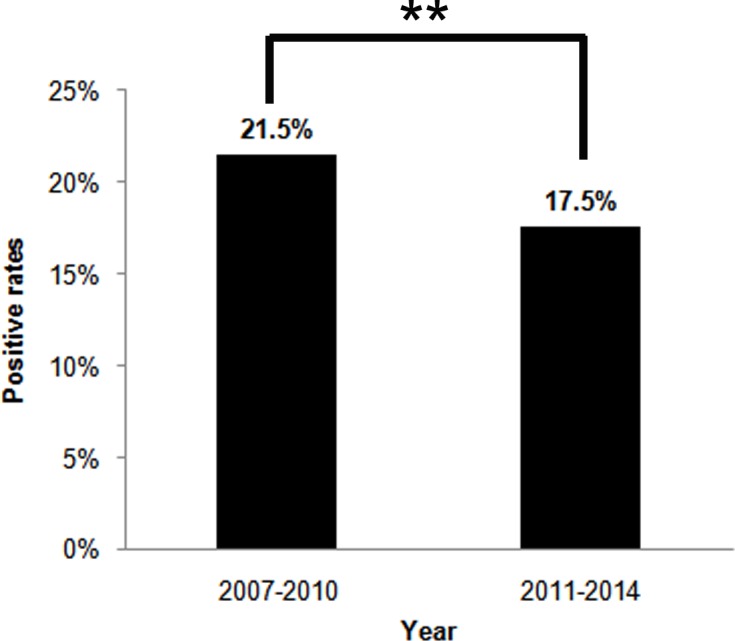
Figure 2. The H. pylori infection rates between two four-year period, 2007–2010 and 2011–2014.

The percentages on top of the bars represent the total H. pylori infection rates in four-year periods. **p < 0.01.

The percentages on top of the bars represent the total H. pylori infection rates in four-year periods. **p < 0.01.