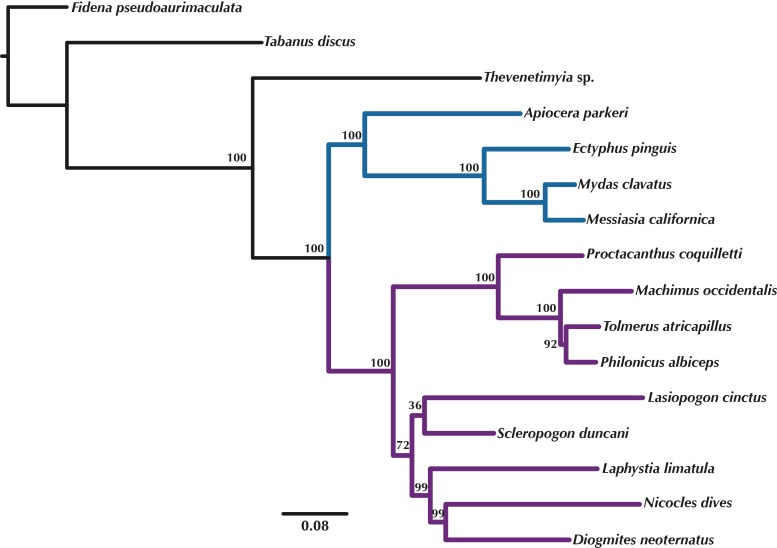
Figure 5. Maximum Likelihood tree of the concatenated matrix of orthologous transcripts predicted in OMA from RAxML.
Included are orthologs represented by four or more species and Bootstrap values are shown above the branches. Purple branches = Asilidae, blue branches = Apioceridae + Mydidae. Figshare doi: 10.6084/m9.figshare.4055910.

