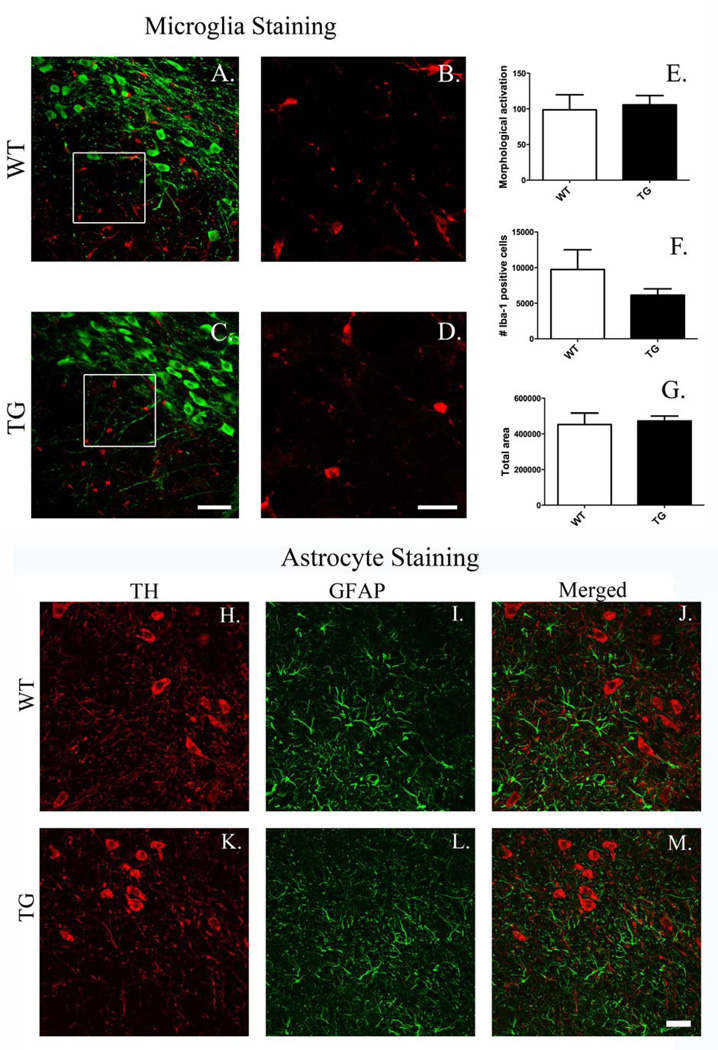
Figure 11.
Microglial and astrocyte morphology in the substantia nigra. There are no detectable differences in microglial density or morphology or in overt astrocyte activation between G2019S LRRK2 (TG) and wild-type (WT) rats in the substantia nigra. A, C show representative images of coronal sections stained for tyrosine hydroxylase (green) and Iba1 (red) (magnification bar = 50 µm). B, D Show high magnification images (insets from A, C) of Iba+ cells (red) (magnification bar = 20 µm). No changes were detected in microglial density or morphology between G2019S LRRK2 TG (C, D) and WT (A, B) rats. Quantitative stereological analysis conducted on Iba-1+ cells did not reveal differences between groups in microglial activation (E), number (F), or overall cell area (pixels) (G) (4–5 sections/animal; n = 5/group; data expressed as mean ± S.E.M.). Glial fibrillary acidic protein (GFAP) staining (I, L) in the SN did not produce evidence of astrocyte activation in TG rats (K–M) compared to WT rats (H–J). Magnification bar = 25 µm.

