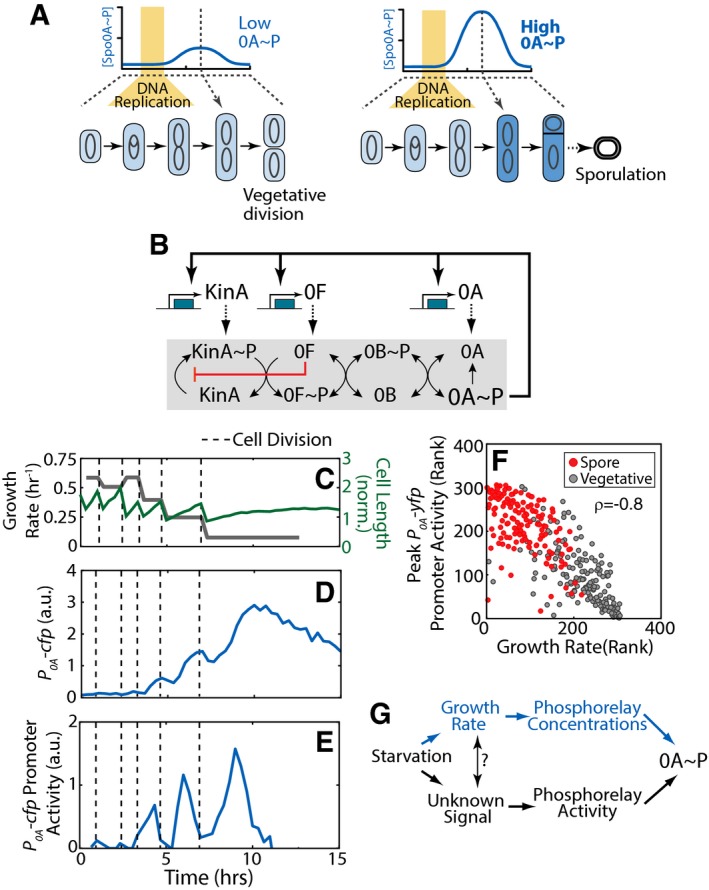
Figure 1. Decision making during Bacillus subtilis sporulation.

-
ASporulation commitment depends on the amplitude of a cell‐cycle‐coordinated pulse of the sporulation master regulator Spo0A˜P (0A˜P). Yellow bars indicate the DNA replication phase.
-
BThe sporulation phosphorelay network that controls 0A˜P formation (see text for details).
-
C–ESingle‐cell time‐lapse microscopy using a P 0A ‐cfp reporter for 0A˜P. (C) Cell length (green) and its cell growth rate, that is, cell‐cycle‐averaged log‐derivative, (gray), for a single cell traced over multiple cell cycles in starvation media. Expression level of P 0A ‐cfp (D) increases in non‐monotonic fashion. Its promoter activity (defined as production rate, an indicator of 0A˜P level) shows pulses with an increased amplitudes that is coordinated with a decrease in growth rate (E). In (C–E), vertical dashed lines indicate cell divisions.
-
FMeasurements of P 0A ‐yfp promoter activity show that 0A˜P pulse amplitudes and growth rates are anti‐correlated. Each dot corresponds to ranked measurements of the P 0A ‐yfp promoter activity pulse amplitude and growth rate of an individual cell cycle. Red and gray dots indicate cell cycles that end in sporulation and vegetative division, respectively. The resulting Spearman's rank correlation ρ = −0.8, P‐value < 10−60, N = 307.
-
GTwo hypothetical mechanisms behind the observed correlation. Starvation may be detected by the sporulation network via growth rate modulation of phosphorelay concentrations or by modulation of phosphorelay activity by growth‐rate‐correlated signal/metabolite.
Source data are available online for this figure.
