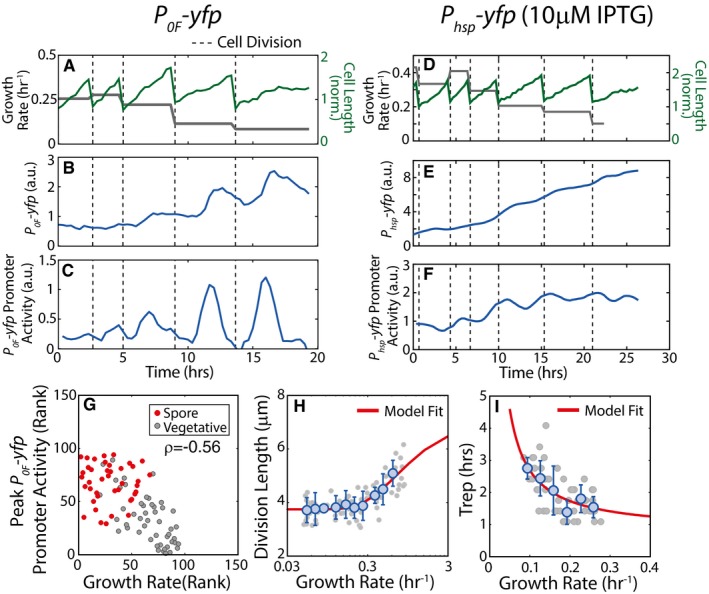
Figure EV1. Effect of growth slowdown on pulsing cell volume and DNA replication.

-
ASingle‐cell time‐lapse microscopy measurements of cell length (green) and cell growth rate (gray), over multiple cell cycles in starvation media. In (A–C), vertical dashed lines indicate cell divisions.
-
BFluorescence measurements for P 0F ‐yfp reporters in WT background show that the expression level of P 0F ‐yfp increases in non‐monotonic fashion.
-
CPromoter activity of P 0F ‐yfp reporter shows pulses once every cell cycle. Promoter activity pulse amplitudes increase as growth rate decreases.
-
D–FSame as (A–C) except for an IPTG‐inducible P hsp ‐yfp reporter in WT background induced with 10 μM IPTG. Note that promoter activity of P hsp ‐yfp reporter (F) does not shows pulses.
-
GMeasurements of P 0F ‐yfp promoter activity show that the pulse amplitudes and growth rates are anti‐correlated. Each dot corresponds to ranked measurements of the P 0A ‐yfp promoter activity pulse amplitude and growth rate of an individual cell cycle. Red and gray dots indicate cell cycle that ends in sporulation and vegetative division, respectively. The resulting Spearman's rank correlation ρ = −0.56, P‐value < 10−60, N = 94.
-
HMeasurements of cell length at division show that cell size decreases with decreasing growth rate. Gray circles show cell lengths at division over 25 h of growth slowdown in starvation conditions (N = 72 individual cell cycles). Blue circles and error bars show the mean and standard deviations of division length measurements binned according to growth rate (N > 3 for each bin). Solid line indicates the phenomenological fit (L(μ) = 3.466*exp(−0.689/μ)+3.743 μm) for cell length dependence on growth rate that we use in our models.
-
IMeasurements of Trep, the duration of DNA replication period at different cell growth rates. Gray circles show Trep measured by detecting DnaN‐YFP foci over 25 h of growth slowdown in starvation conditions (N = 178 individual cell cycles). Blue circles and error bars show the mean and standard deviations of Trep measurements binned according to growth rate (N > 5 for each bin). Solid line indicates the phenomenological fit (Trep(μ) = 0.15/μ+0.78 h) for DNA replication period dependence on growth rate that we use in our models.
Source data are available online for this figure.
