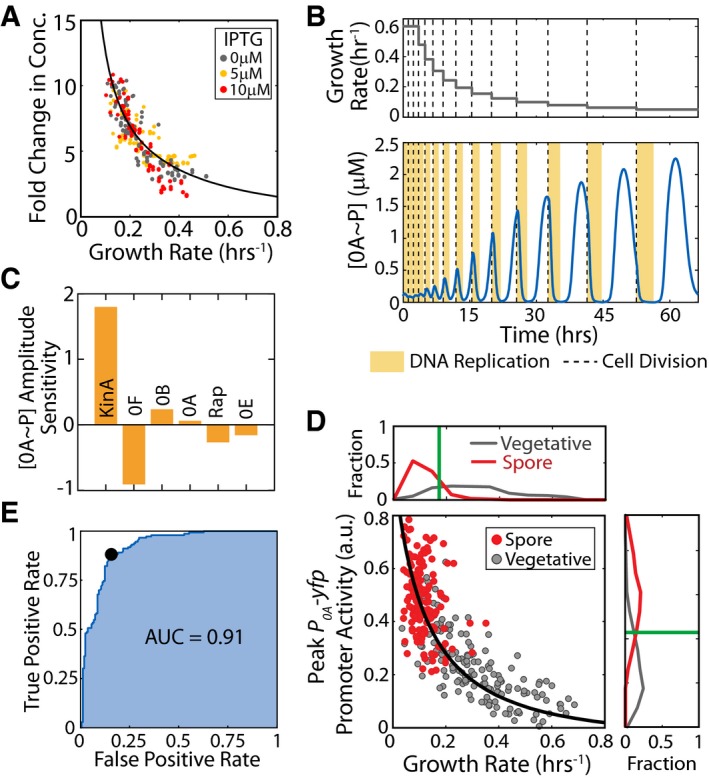
Figure 2. Decrease in growth rate affects 0A~P levels and controls cell fate.

- Fold change in P hsp ‐yfp fluorescence levels as a function of growth rate for different IPTG inducer concentrations. Black line represents a model fit for the effect of growth rate on the concentration of stable proteins.
- Model time course of 0A˜P during starvation showing cell‐cycle‐coordinated pulsing. Upper and lower panels show the growth rate (input) and 0A˜P response (output), respectively. Yellow bars and dashed lines represent DNA replication periods and cell division, respectively. The effect of growth rate on protein levels was modeled following the results shown in (A). The simulation predicts that 0A˜P pulse amplitudes increase with decreasing cell growth rate.
- Sensitivity of the growth rate—0A˜P pulse amplitude relationship to changes in the gene expression of phosphorelay components. Model simulations showed that 0A˜P pulse amplitudes were most sensitive to changes in the production rate of kinase KinA. Increase in 0F caused a significant decrease in 0A˜P pulse amplitude. 0A˜P was found to be relatively insensitive to changes in other phosphorelay components.
- Measurements of P 0A ‐yfp promoter activity confirm that 0A activity pulse amplitudes increase as growth rate decreases during starvation. Each dot corresponds to a single cell cycle. Gray and red dots correspond to cell cycles that end in vegetative division and spores, respectively. Solid lines show the model predictions. Panels to the right and bottom show histograms of P 0A ‐yfp promoter activity and (growth rate)−1 for cell cycles that end in vegetative division (gray) and spores (red) for each strain. Vertical green lines show the thresholds that can be used to predict cell fate in each case.
- Receiver operating characteristic (ROC) curve for growth‐based cell‐fate prediction. Blue line shows the relation between false‐positive rate and true‐positive rate for different values of growth rate threshold. The black dot marks the optimal growth rate threshold that minimizes classification error. The high area under the ROC curve (AUC = 0.91) indicates that growth rate is a highly robust predictor of sporulation.
Source data are available online for this figure.
