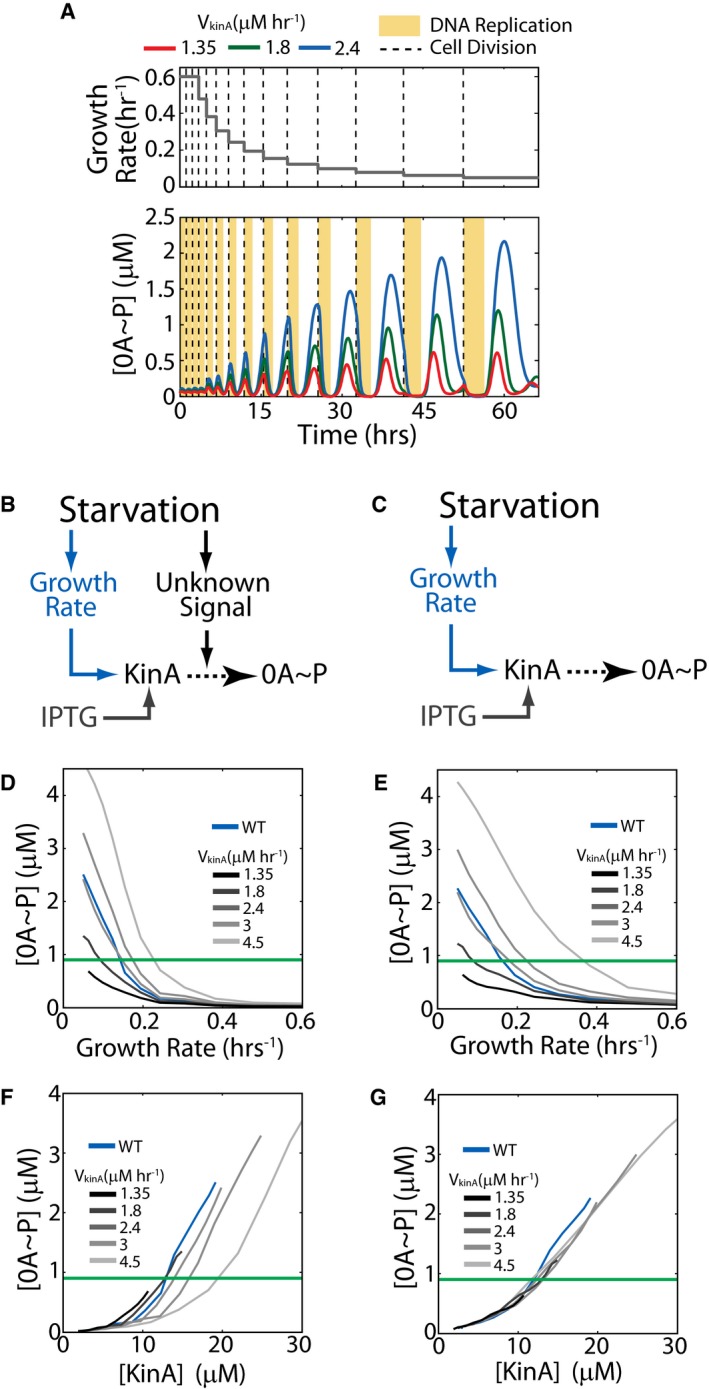
Figure EV4. Model predictions for 0A~P pulsing in an inducible KinA strain.

-
AModel time course for an inducible KinA strain showing cell‐cycle‐coordinated 0A˜P pulsing. Upper and lower panels show the growth rate (model input) and 0A˜P response (simulation result), respectively. Red, green, and blue curves show the 0A˜P response at increasing rates of KinA production (VkinA) from an inducible promoter. Yellow bars and dashed lines represent DNA replication periods and cell division, respectively. The simulation predicts that 0A˜P pulses in the inducible KinA strain and that similar to WT, pulse amplitudes increase with decreasing cell growth rate and with increase in KinA induction.
-
B, CTwo alternative hypotheses for the relationship between starvation, 0A˜P, and sporulation cell fate. (B) Starvation controls 0A activation by affecting cell growth and by increasing KinA activity via an unknown signal. (C) Starvation controls 0A activation by affecting only cell growth but not KinA activity.
-
D, EModel predictions for the dependence of the 0A˜P pulse amplitudes on growth rate under the signal‐dependent (D) and signal‐independent (E) KinA activity hypotheses. The green line shows the 0A˜P threshold used in model simulations to predict cell fate. Note that the growth rate threshold (growth rate at which the 0A˜P threshold is reached) depends on the KinA production rate (VkinA) under both hypotheses.
-
F, GModel predictions for the dependence of the 0A˜P pulse amplitudes on KinA under the signal‐dependent (F) and signal‐independent (G) hypotheses. The green line shows the 0A˜P threshold used in model simulations to predict cell fate. Note that the KinA threshold (KinA level at which the 0A˜P threshold is reached) depends on the KinA production rate (VkinA) under the signal‐dependent (F) but not the signal‐independent (G) KinA activity.
