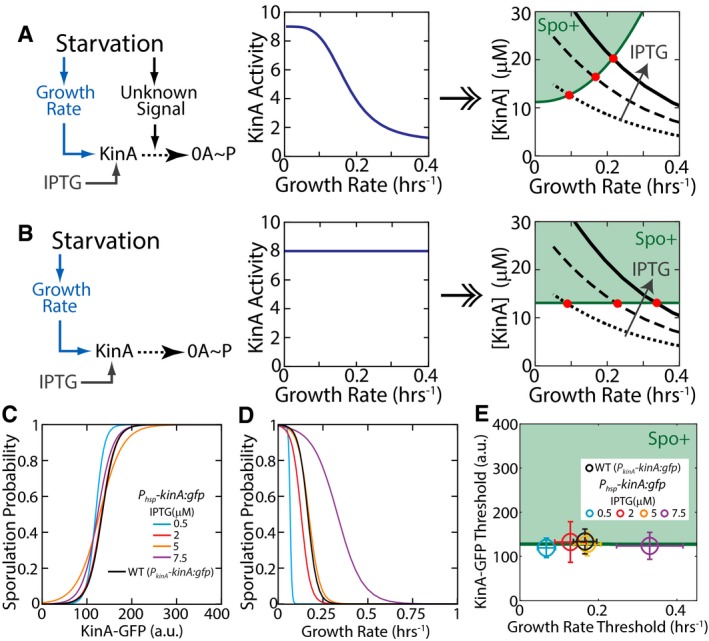
Figure 5. Decrease in growth rate affects 0A~P levels and controls cell fate.

-
AStandard hypothesis for the relationship between starvation, 0A˜P, and sporulation cell fate. Starvation affects cell growth and an unknown signal that controls 0A activation by KinA. Growth rate and unknown signal level are interrelated since they both depend on starvation. Under this hypothesis, the minimum level of KinA necessary to make cells sporulate is a function of the unknown signal level (middle panel) and by extension the growth rate (right panel). This hypothesis predicts that changes in KinA production rate using an IPTG‐inducible system should lead to a change in both the KinA threshold and growth rate threshold for sporulation (red dots).
-
BAlternative hypothesis: Signals controlling KinA activity play a negligible role in determining 0A activation and sporulation cell fate. Under this hypothesis, the KinA threshold for sporulation is independent of the unknown signal level (middle panel) and by extension the growth rate (right panel). This hypothesis predicts that changes in KinA production rate using an IPTG‐inducible system should lead to a change in the growth rate threshold for sporulation but not the KinA threshold (red dots).
-
C, DLogistic regression curves indicating the probability of producing a spore as predicted using measurements of KinA‐GFP level (C) and growth rate (D).
-
EKinA and growth rate thresholds for sporulation in the Phsp‐KinA and WT strains. KinA and growth rate thresholds were calculated using the results of the logistic regression in (C, D), respectively. Significance of IPTG dependence of KinA and growth thresholds was determined by logistic regression of pooled data (N pooled = 547) and applying a t‐test to determine whether the regression coefficient for IPTG level is zero (see Materials and Methods for details). Note that the KinA threshold does not depend on IPTG level (P‐value for IPTG coefficient = 0.70784, N pooled = 547), whereas the growth rate threshold decreases with increasing IPTG (P‐value for IPTG coefficient = 2.601e‐26, N pooled = 547) as predicted by the alternative hypothesis in (B). Error bars show standard errors.
Source data are available online for this figure.
