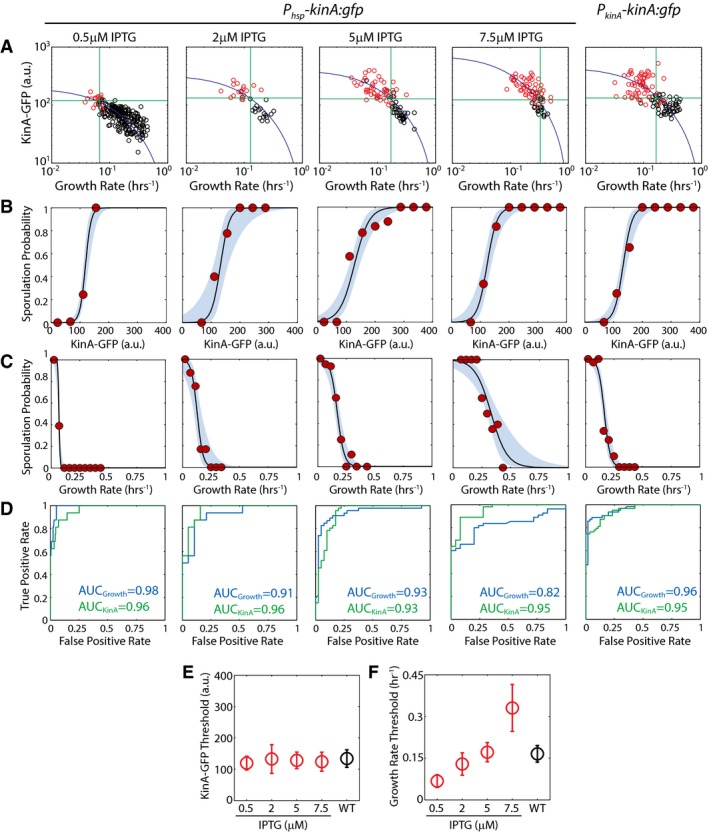
Figure EV5. Experimental measurement of the sporulation cell‐fate outcomes as a function of KinA level and growth rate.

- KinA‐GFP levels in the IPTG‐inducible P hsp ‐kinA:gfp (at different IPTG concentrations) and WT (P kinA ‐kinA:gfp) as a function of cell‐cycle growth rate. Measurements confirm that 0A activity KinA‐GFP levels increase as growth rate decreases during starvation. Each dot corresponds to a single cell cycle. Black and red dots correspond to cell cycles that end in vegetative division and spores, respectively. Blue solid lines show the model predictions for KinA dependence on growth rate (same as that used in Fig 2A). Horizontal and vertical green lines show the thresholds that can be used to predict cell fate as a function of KinA level and growth rate, respectively.
- Probability of sporulation as a function of KinA‐GFP levels calculated using logistic regression on the data in (A). Solid lines and blue areas indicate the logistic regression curves and the 95% confidence intervals. Red dots show the fraction of cells sporulating calculated by binning data in linearly spaced bins of KinA‐GFP.
- Probability of sporulation as a function of growth rate calculated using logistic regression on the data in (A). Solid lines and blue areas indicate the logistic regression curves and the 95% confidence intervals. Red dots show the fraction of cells sporulating calculated by binning data in linearly spaced bins of growth rate.
- Receiver operating characteristic (ROC) curves for KinA‐GFP‐based and growth‐based cell‐fate prediction. Green and blue lines show the relation between false‐positive rate and true‐positive rate for different values of KinA‐GFP and growth rate threshold.
- KinA‐GFP thresholds calculated using the results of the logistic regression in (B). Error bars show standard errors. Significance of IPTG dependence of KinA threshold was determined by logistic regression of pooled data (N pooled = 547) and applying a t‐test to determine whether the regression coefficient for IPTG level is zero (see Materials and Methods for details). Note that the KinA threshold does not depend on IPTG level (P‐value for IPTG coefficient = 0.70784, N pooled = 547).
- Growth rate thresholds calculated using the results of the logistic regression in (C). Error bars show standard errors. Growth rate threshold increases with IPTG level (P‐value for IPTG coefficient = 2.601e‐26, N pooled = 547).
Source data are available online for this figure.
