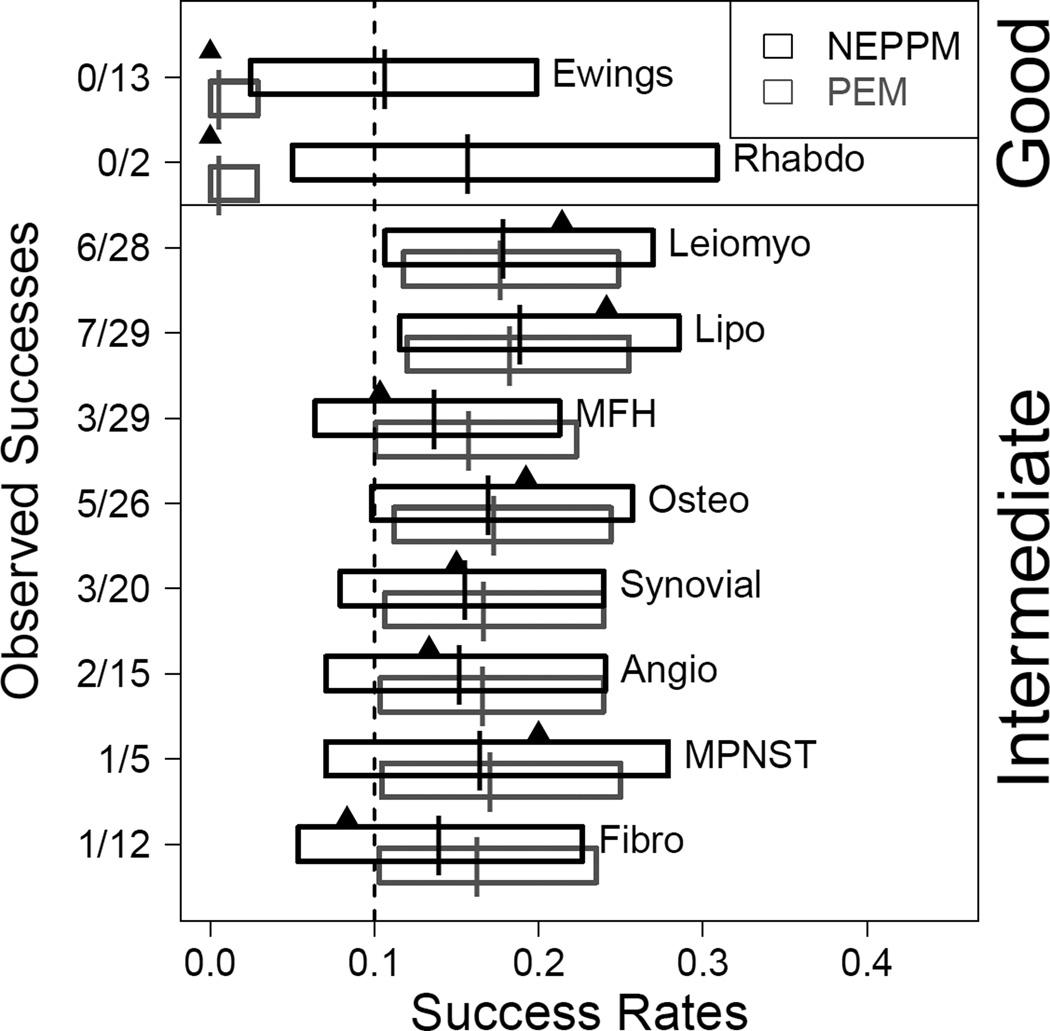
Figure 2.
Central 90% credible intervals of the success probabilities for each sarcoma subtype under the proposed NEPPM (black boxes) with parameter γ = 1 and under the PEM (grey boxes). The vertical lines in the boxes indicate the posterior means, and the triangles represent the proportion of successes within each subtype. For reference the dashed vertical line marks 0.1. The first two subtypes are sarcoma subtypes with good prognosis. The remaining eight are subtypes with intermediate prognosis. Note how the PEM borrows strength across all disease subtypes within the same (fixed) prognosis group.

