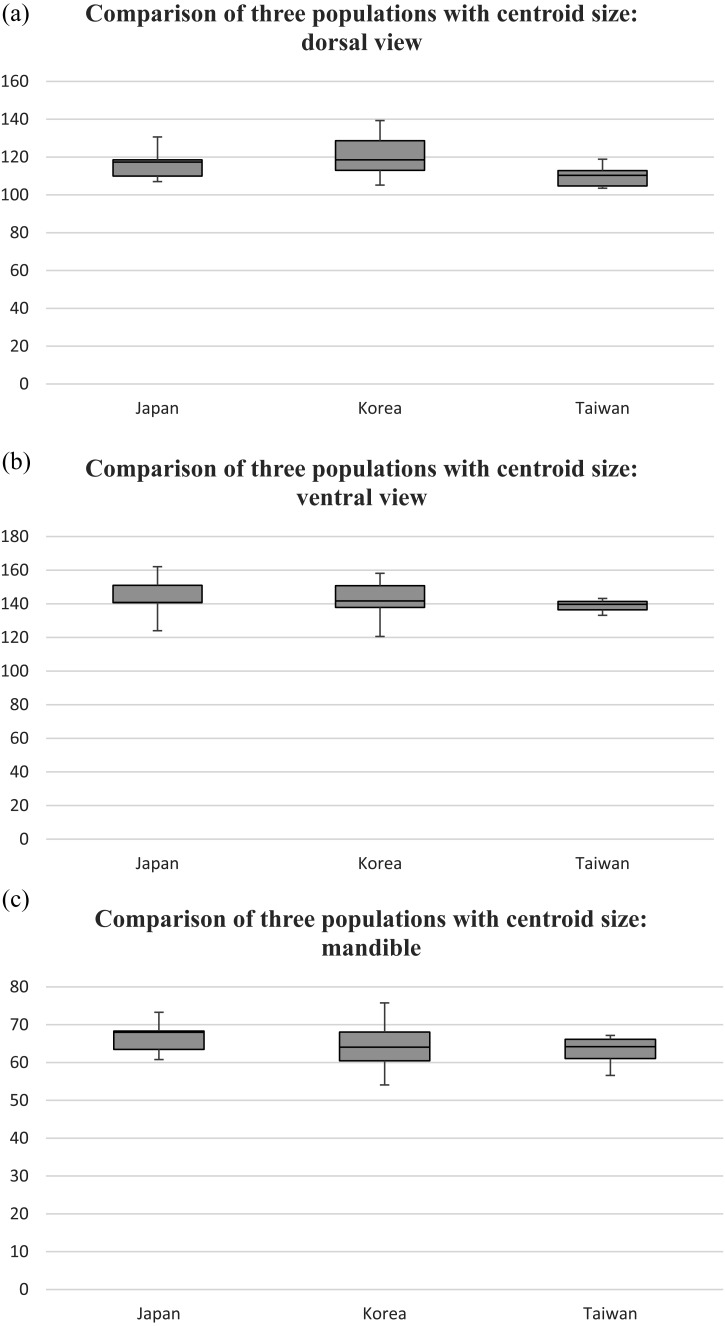
Fig. 3.
Box plots of each population (X axis) from Japanese islands, Korean peninsula and Kinmen Island, Taiwan (termed as Japan, Korea and Taiwan in chart) were compared for (a) dorsal view; (b) ventral view of the cranium and (c) mandible with the centroid size (Y axis). The third quartile is indicated by the first horizontal line, following by the median and the first quartile. The whiskers extend to the maximum value (on the top) and minimum value (on the bottom).

