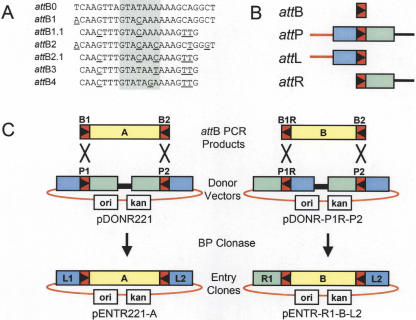
Figure 1.
Summary of att sites and BP cloning. (A) List of attB sites; attB0 is the E. coli λ bacteriophage attachment site (Landy 1989). Shaded area indicates 7-bp overlap (Int cut sites); underlined bases indicate changes from attB0. (B) Schematic diagram of recombination sites. (Red rectangles) attB sites, the orientation of the asymmetric overlap region is indicated by the triangle. (Blue and green rectangles) attL and attR arms, respectively. (Red line) vector backbone segment; (black line) ccdB counter selection gene (Bernard and Couturier 1992) and chloramphenicol acetyltransferase (cat) selection marker. (C) Examples of BP cloning of attB PCR products into Donor Vectors to generate Entry Clones. Note that reversing the orientations of both the attB1 site in the PCR product and attP1 site in the Donor Vector results in an attR1 site in the Entry Clone.

