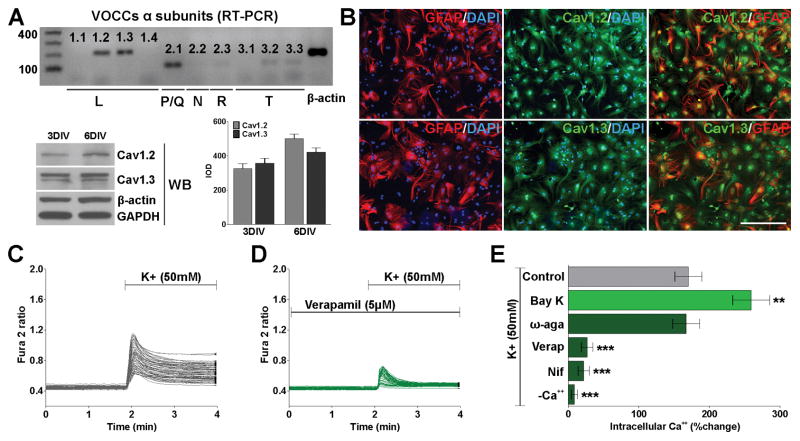
FIGURE 1. L-type Ca++ channels are the predominant VOCCs in the plasma membrane of cortical astrocytes.
(A) Semi-quantitative RT-PCR and western blots analysis of VOCC α1 subunits expression in cortical astrocytes. The analysis was performed after 3 and 6 days in vitro (DIV) using β-actin and GAPDH as internal standards. Data from three independent western blots are summarized based on the relative spot intensities and plotted as percent of controls. (B) After 6DIV, astrocytes were stained with antibodies against GFAP, Cav1.2 and Cav1.3. Scale bar = 80μm. (C and D) VOCC activity was examined in cultured astrocytes at 6DIV using fura-2 as intracellular Ca++ indicator. Note that each trace corresponds to a single cell and the horizontal bars indicate the time of addition of external solution containing high K+ and verapamil. (E) The bar graph shows the average amplitude of the Ca++ response, calculated from the responding cells expressed as a percentage of change of the emission intensities. VOCC modulators were applied at the following final concentration: Bay K 8644 (5μM), ω-agatoxin IVA (1μM), verapamil (5μM) and nifedipine (5μM). Values are expressed as mean ± SEM of at least six independent experiments. **p<0.01, ***p<0.001 vs. control.

