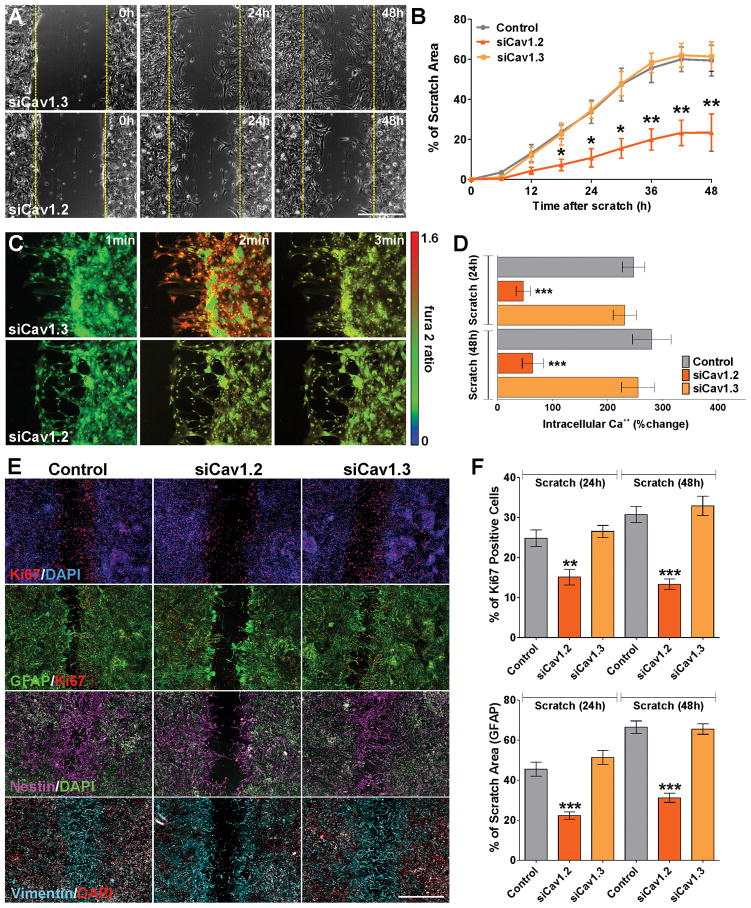
FIGURE 8. Cav1.2 knock-down prevents astrocyte activation after scratch.
Immediately after the scratch, cortical astrocytes were incubated in a chamber with 5% CO2 at 37°C, which was placed on the stage of a spinning disc confocal microscope. (A) Time-lapse series of siCav1.2/1.3 transfected cultures. The original site of the scratch is marked by a yellow dotted line and time is denoted in hours in the upper right corner. Scale bar = 160μm. (B) The percentage of the initial scratched area covered by cells was measured in each experimental condition every 6h for a period of 48h. (C) VOCC activity was examined 24h after the scratch using fura-2 as intracellular Ca++ indicator. Each frame represents a single section of a fura-2 time-lapse experiment. An increased fura-2 fluorescence ratio is indicated by warmer colors. Scale bar = 100μm. (D) Fura-2 imaging of Ca++ responses to 50mM K+ in control and siCav1.2/1.3 transfected astrocytes at 24 and 48h after the scratch. (E and F) Control and siCav1.2/1.3 transfected astrocytes were scratched and immunostained for the astrocyte markers GFAP, nestin and vimentin or the proliferation marker Ki67 at 24 and 48h after the scratch. (E) Examples of control and siCav1.2/1.3 transfected cultures 48h after the scratch. Scale bar = 180μm. (F) The percentage of the initial scratched area covered by GFAP positive cells and the percentage of Ki67-positive cells located in the scratch area were quantified in each experimental conditions at 24 and 48h after the scratch. Values are expressed as mean ± SEM of at least six independent experiments. **p<0.01, ***p<0.001 vs. respective controls.

