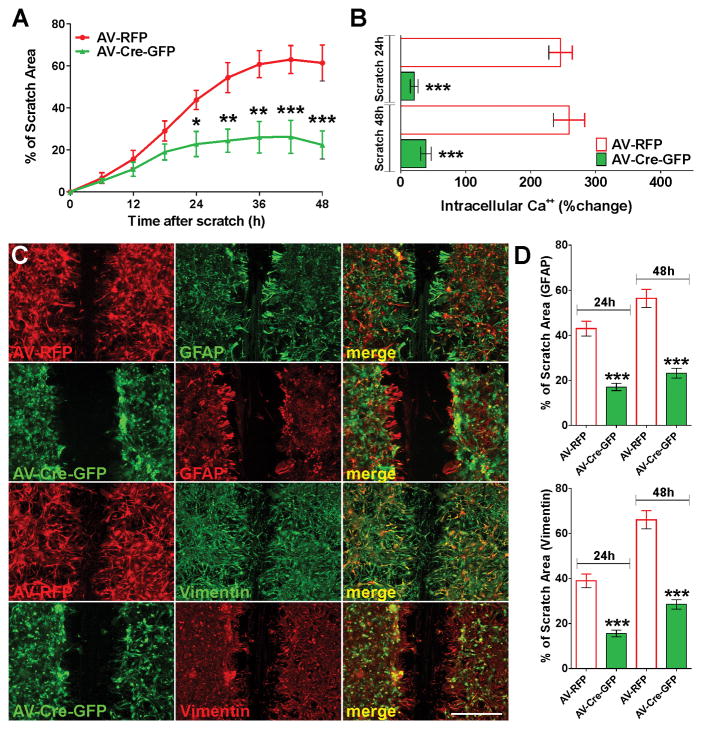
FIGURE 9. Cav1.2 KO astrocytes show less reactivity following mechanical damage.
Immediately after the scratch, cortical astrocytes were incubated in a chamber with 5% CO2 at 37°C, which was placed on the stage of a spinning disc confocal microscope. (A) The percentage of the initial scratched area covered by cells was measured for control (AV-RFP) and Cav1.2 KO astrocytes (AV-Cre-GFP) every 6h for a period of 48h. (B) Fura-2 imaging of Ca++ responses to 50mM K+ in control and Cav1.2 KO astrocytes at 24 and 48h after the scratch. The bar graph shows the average amplitude of the Ca++ response, calculated from the responding cells expressed as a percentage of change of the emission intensities. (C and D) Control and Cav1.2 KO astrocytes were scratched and immunostained for the astrocyte markers GFAP and vimentin at 24 and 48h after the scratch. (C) Examples of control and Cav1.2 KO cultures immunolabeled with GFAP 48h after the scratch. Scale bar = 160μm. (D) The percentage of the initial scratched area covered by GFAP and vimentin positive cells was quantified in each experimental condition at 24 and 48h after the scratch. Values are expressed as mean ± SEM of at least six independent experiments. ***p<0.001 vs. respective controls (AV-RFP).

